
The faster and more aggressively pitchers throw, the more wear and tear they place on their internal structures. There is a commonly held belief that 100 pitches is the point where a pitcher should be pulled because of the increased risk for injury moving forward. While this seemed to be the case in 2011, as the visualization below shows, pitching stints have decreased year after year and in the 2020 and 2021 seasons, were the lowest of the past ten years.
All in all, pitching stints are getting shorter, and starting pitchers are getting pulled faster.
ggplot(x, aes(x = x$Pitches, y = as.factor(x$Year), fill = stat(x))) +
geom_density_ridges_gradient()+
scale_fill_viridis_c(option="inferno")+
theme(panel.background = element_rect(fill='white'))+
theme(panel.grid.major = element_blank(),panel.grid.minor = element_blank())+
guides(fill="none")+
xlab("Number of Pitches Thrown")+
ylab("Year")+
coord_cartesian(clip = "off")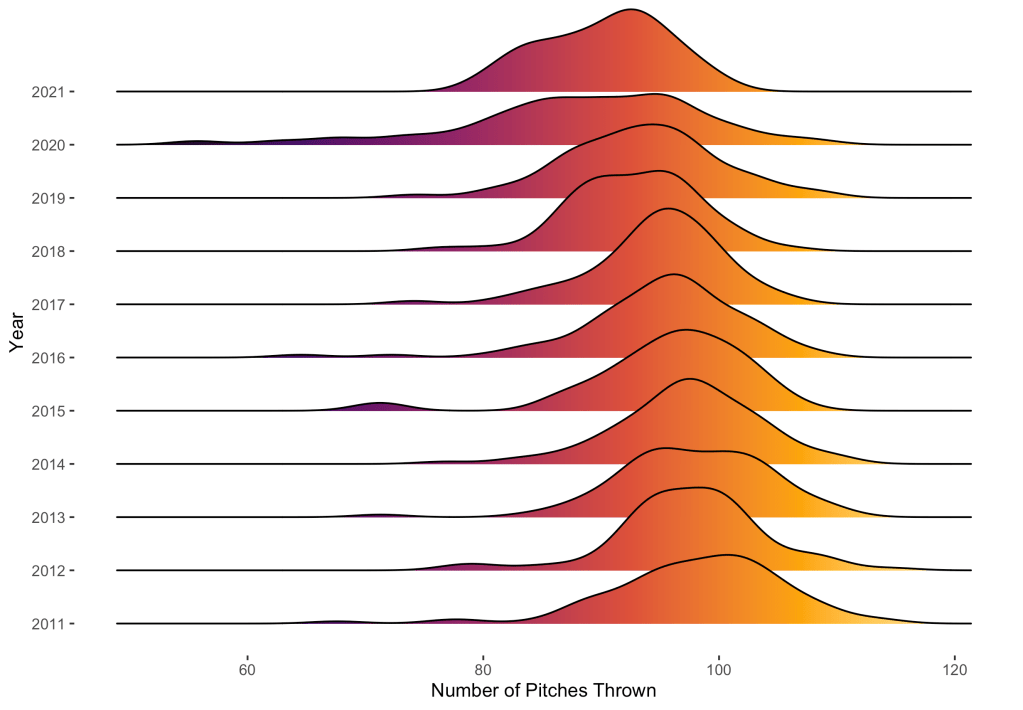

Leave a comment