
Problem: There is no way to adjust a batter’s SO% and BB% based on the quality of pitchers they have faced throughout the season.
Solution:
The Quality of Competition (QoC) metric is a weighted-average ratio of the average league caliber pitcher compared to the caliber of pitchers a specific batter faced in a given season.
The QoC metric is calculated based on the following equation:
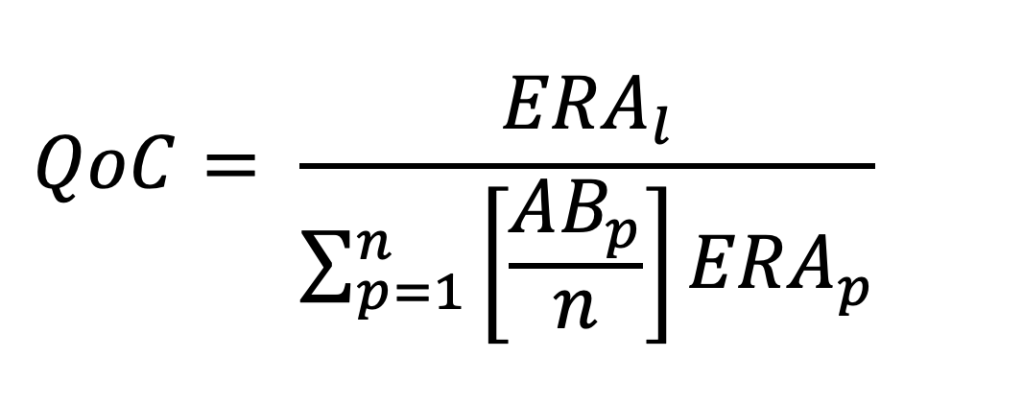
Where, QoC is Quality of Competition, ERAl is the league-average earned runs average (ERA), n is the number of pitchers a batter faced in a given season, p is an individual pitcher, ABp is the number of at-bats taken by a batter for a given pitcher p over the course of the season, and ERAp is the season-average ERA of the specific pitcher .
The denominator of the equation creates a weighted-average ERA of pitchers faced using the specific at-bats by each individual batter. When divided using the league-average ERA as the numerator, this metric creates a linear scaling representation of the caliber of pitcher faced during all at-bats as compared to the league average. The QoC metric has been structured in such a way so that a higher value represents stronger competition, and a lower value represents weaker competition, as compared to the league-average. A QoC value > 1 represents that a specific batter faced an above-average caliber of pitchers within a season, and < 1 represents a below-average caliber of pitchers.
The QoC metric can then be used as a scaling factor for both SO% and BB% in the following ways:
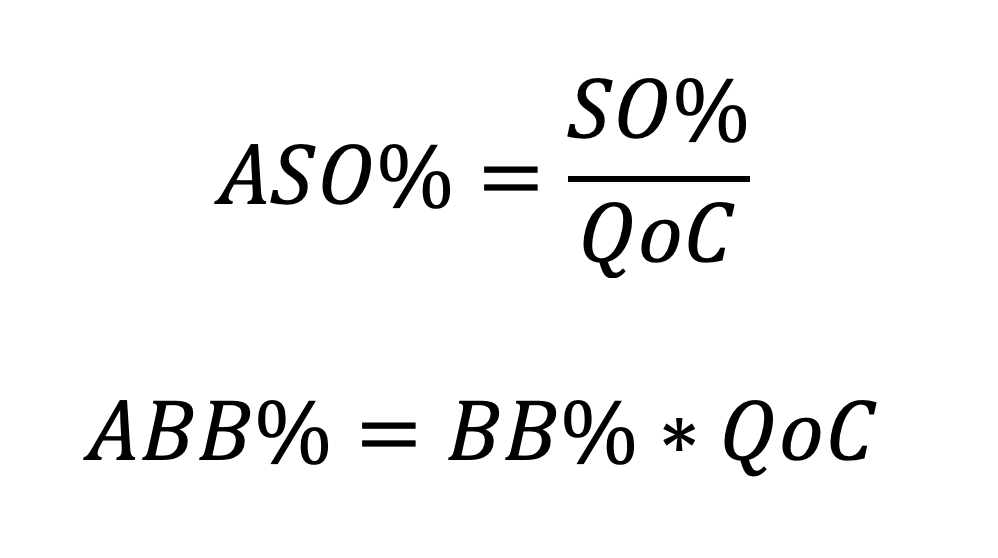
Where, ASO% is adjusted strike out percentage, ABB% is adjusted base on balls percentage, SO% is standard strike out percentage, and BB% is standard base on balls percentage.
When adjusted, ASO% and ABB% will demonstrate SO% and BB% that are scaled based on the caliber of pitchers faced in a season. The SO% is divided by the QoC to calculate ASO% as a lower SO% indicates better performance against higher caliber pitchers. Conversely, the BB% is multiplied by the QoC to calculate ABB% as a higher BB% indicates better performance against higher caliber pitchers.
Example
For example, to indicate a batter faced a higher-than-average caliber of pitchers in a given season, their adjusted strikeout rate should be lower than their actual strike out rate. For a batter with a QoC score of 1.15, a higher-than average caliber of pitchers faced during a season, and a strikeout rate of 0.14, the following equation is used to calculated adjusted strikeout rate:

The adjusted strikeout rate of 0.12 compared to the actual strikeout rate of 0.14 indicates that this specific batter faced a high-caliber set of pitchers during the season.
Assumptions & Limitations
While I believe this methodology is sound, there were some decisions and assumptions that had to be made. Specifically, ERA was chosen as a measure of pitcher caliber for simplicity. Using a value like K/BB ratio was debated, but ultimately was not used as I am defining “caliber” of a pitcher more generally and did not want to restrict myself with a metric that only used strikeouts and walks, even if those were the values being adjusted at the end of the process.
This methodology also assumes that pitchers are always pitching at their season-average caliber. While pitchers have inherent variability in their performance over the course of a season, I do not believe this would significantly skew the results of the scaling.
Code
I have written R code to allow this metric to be used for any batter for any season. The code uses the following general data frame structure to output a QoC value.
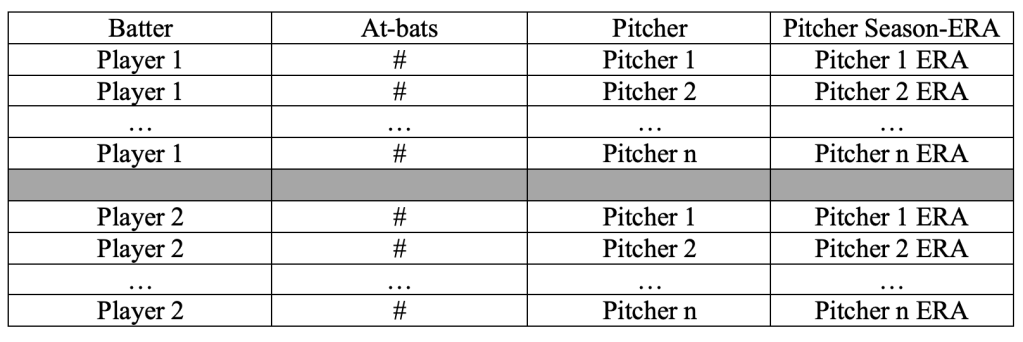
This analysis requires (1) batter vs. pitcher data and the at-bats for each specific combination of batter and pitcher, and (2) season-average pitcher ERA values. The former can be found at this link, and the latter can be found at this link.

Leave a comment